Dubai Climate
I was visiting Dubai in February (2026) and was chatting with some friends how the climate is changing from our early days there (I was there in 2010).
Everyone has anecdotes (even 1 person has one that it is cooling!) and no one seemed to be sure if it's just our memories, biases, etc.
So I downloaded a 20 year daily temperature dataset (daily highs, lows, etc: full description of the dataset at the end) and crunched it (with Claude’s help) to see what's happening:
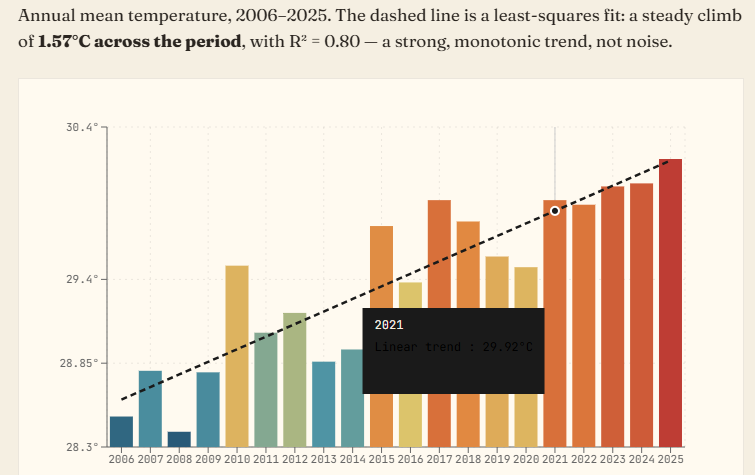
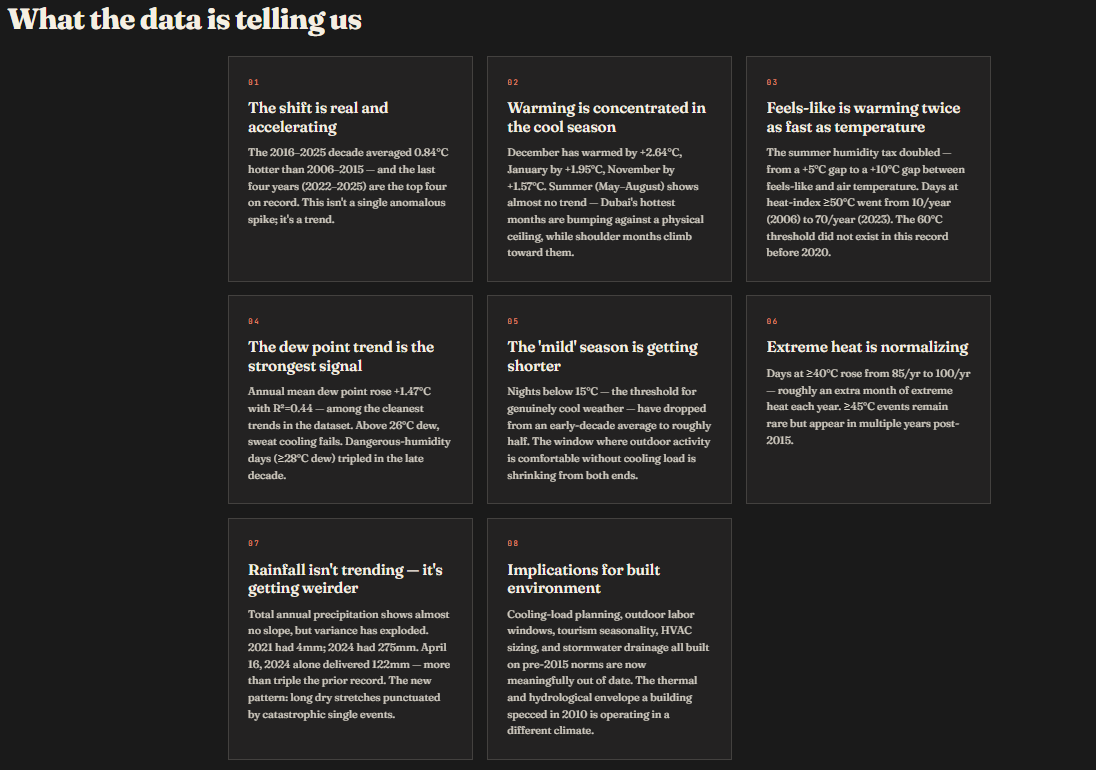
The shift is real and accelerating
The 2016–2025 decade averaged 0.84°C hotter than 2006–2015 — and the last four years (2022–2025) are the top four on record. This isn't a single anomalous spike; it's a trend.
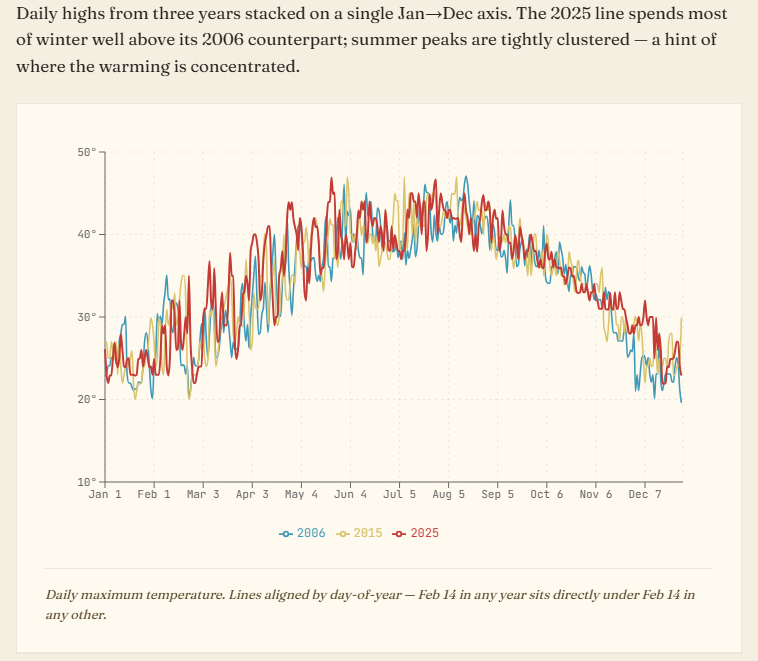
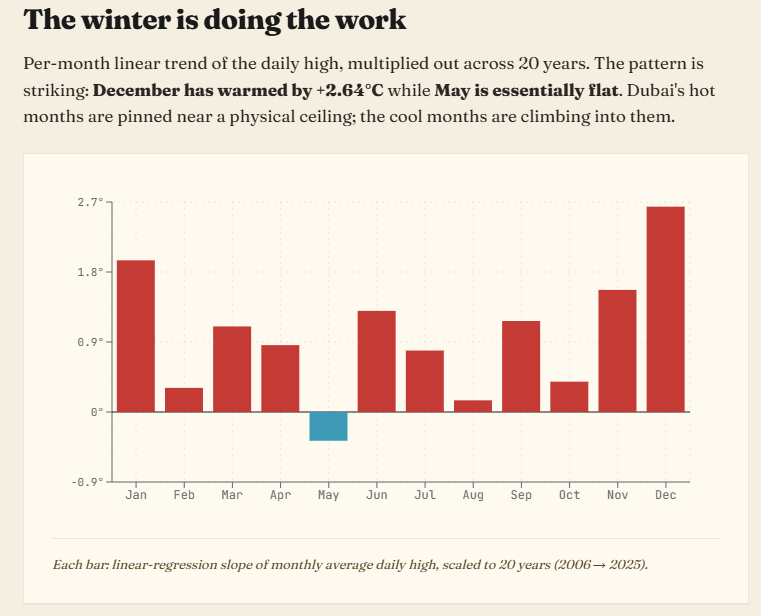
Warming is concentrated in the cool season
December has warmed by +2.64°C, January by +1.95°C, November by +1.57°C. Summer (May–August) shows almost no trend — Dubai's hottest months are bumping against a physical ceiling, while shoulder months climb toward them.
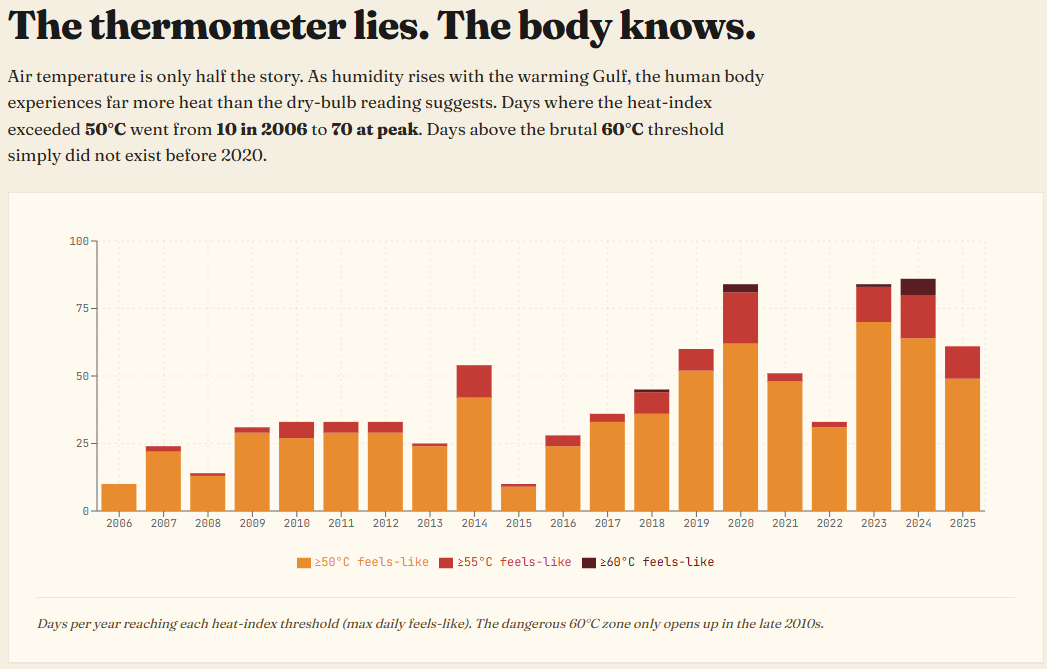
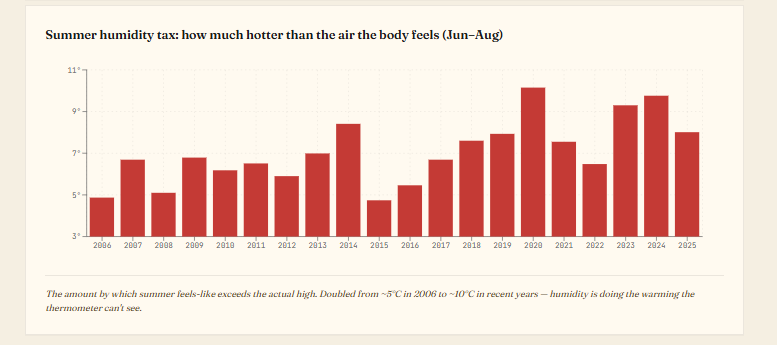
Feels-like is warming twice as fast as temperature
The summer humidity tax doubled — from a +5°C gap to a +10°C gap between feels-like and air temperature. Days at heat-index ≥50°C went from 10/year (2006) to 70/year (2023). The 60°C threshold did not exist in this record before 2020.
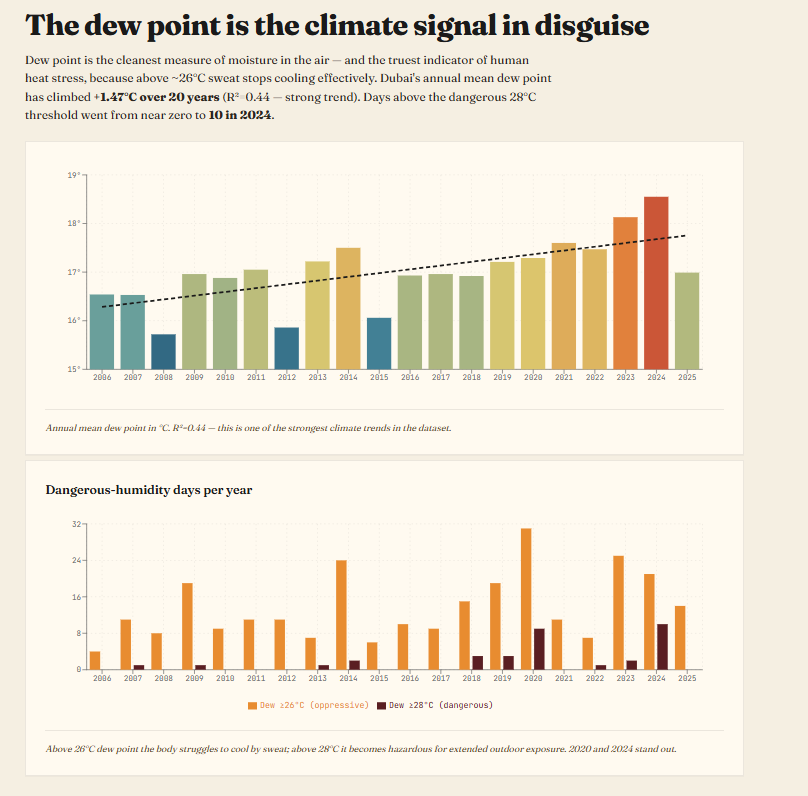
The dew point trend is the strongest signal
Annual mean dew point rose +1.47°C with R²=0.44 — among the cleanest trends in the dataset. Above 26°C dew, sweat cooling fails. Dangerous-humidity days (≥28°C dew) tripled in the late decade.
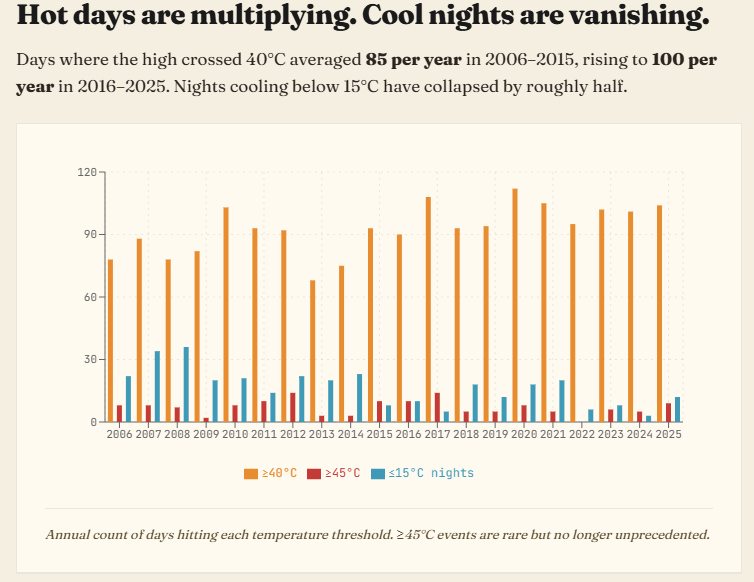
The 'mild' season is getting shorter
Nights below 15°C — the threshold for genuinely cool weather — have dropped from an early-decade average to roughly half. The window where outdoor activity is comfortable without cooling load is shrinking from both ends.
Extreme heat is normalizing
Days at ≥40°C rose from 85/yr to 100/yr — roughly an extra month of extreme heat each year. ≥45°C events remain rare but appear in multiple years post-2015.
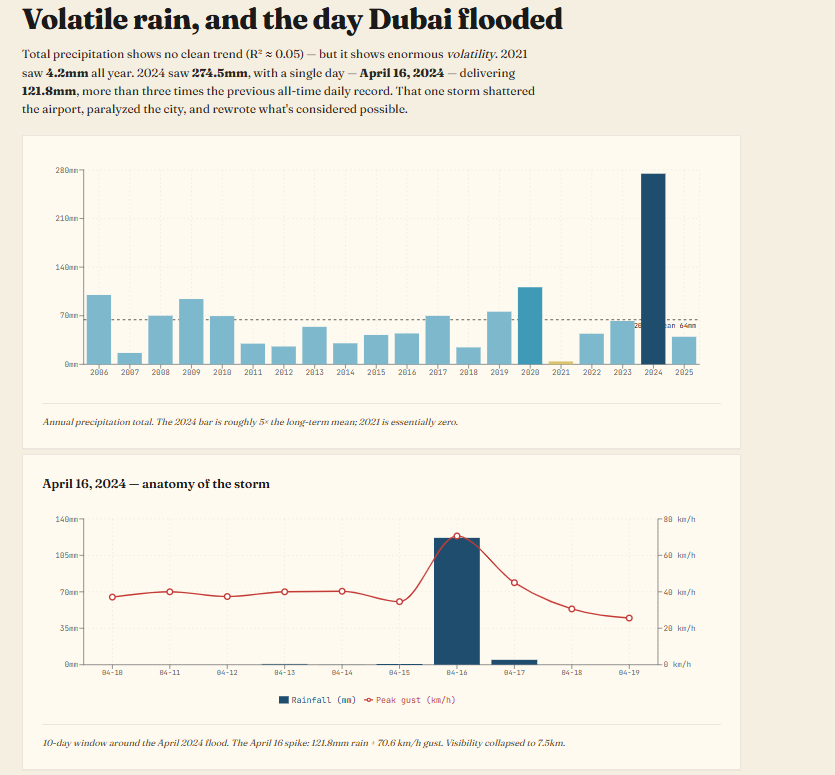
Rainfall isn't trending — it's getting weirder
Total annual precipitation shows almost no slope, but variance has exploded. 2021 had 4mm; 2024 had 275mm. April 16, 2024 alone delivered 122mm — more than triple the prior record. The new pattern: long dry stretches punctuated by catastrophic single events.
Implications for built environment
Cooling-load planning, outdoor labor windows, tourism seasonality, HVAC sizing, and stormwater drainage all built on pre-2015 norms are now meaningfully out of date. The thermal and hydrological envelope a building specced in 2010 is operating in a different climate.